Verification
Overall model results
We looked first at overall model results in terms of calibration and validation. We found some errors in the calculations which when corrected made a difference to the results which are shown in the tables below. Original
refers to the results originally claimed, corrected
shows when the errors found had been corrected. To meet the standard for calibration 85% of the results should satisfy the tests described above.
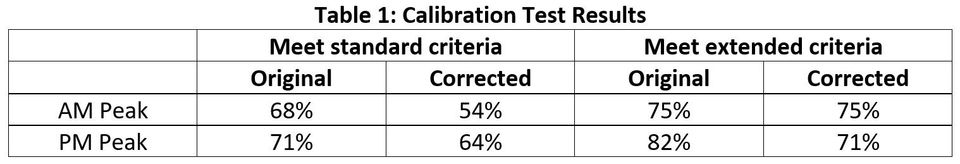
Calibration
From Table 1
it can be seen that the original
results fell short of the 85% by a significant amount for both periods of traffic modelling, and more so when corrected. In view of this the criteria were then extended
(relaxed to make them less demanding) but even then the modelling for both periods failed to meet the required standard of 85% for calibration.
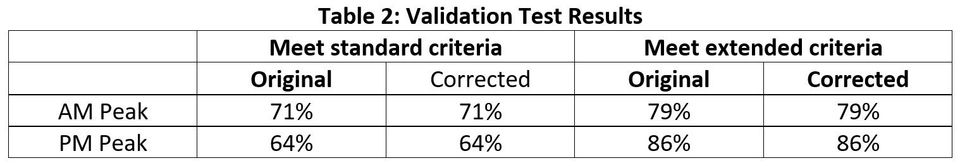
Validation
Table 2
shows the overall results for the validation tests. Once again the standard to meet is 85%.
In this case the original
and corrected
results give the same figures, but again for the standard criteria neither of the modelled periods achieve the required 85%. The standards were once again extended
(relaxed) in which case one period did just meet it, but the other still failed.
The results for calibration and validation, but particularly the former, do not create confidence
in the overall traffic modelling for the Putney Link Road scheme. They suggest that there may be significant margins of error
in any traffic forecasts created by this model.
Moreover, we have been unable to find any reference which says relaxing the standards
in order to achieve a pass rate is an acceptable procedure. It has the appearance of attempting to justify the use of a model which does not reach the required standard of fitness for purpose.